
Lockdown drove pollution changes between – even within – cities
New method allows researchers to measure levels of NO2 on a finer scale, revealing disparities in exposure during COVID
During COVID-19 lockdowns, the internet was flooded with images from Delhi to Los Angeles, showing mountains typically hidden behind smog or clear blue skies where they were once gray.
People speculated that, because fewer people were driving, industry slowed and many airports were functionally closed, levels of pollution had dropped everywhere.
They had, depending on your vantage point.
Researchers from Washington University in St. Louis developed a method using satellite measurements that allowed them to determine levels of nitrogen dioxide — NO2 — on a scale never before accessible — even in areas where there are no monitoring capabilities on the ground. NO2 is a key contributor to the smog associated with bad traffic or areas of intense industry.
Developed in the lab of Randall Martin, the Raymond R. Tucker Distinguished Professor in the Department of Energy, Environmental & Chemical Engineering, the method allows researchers to infer levels of NO2 in regions as small as a neighborhood.
When they used it to compare levels of NO2 before and during COVID-19-related lockdowns across the globe, they found that, although there was a significant decrease in NO2 worldwide in areas under lockdown, there were also striking discrepancies on smaller scales.
The results were published Jan. 19 in the journal Nature.
“We can determine differences, not just from city to city, but within cities we were seeing interesting differences in levels of NO2,” said Matt Cooper, first author of the study. “Changes within cities weren’t uniform; some areas saw a larger decrease than others.”
Prior to the COVID-19-related lockdowns, Cooper had been working on ways to improve the detection of NO2 in the atmosphere using a new satellite technology. Then the pandemic hit.
‘Interesting test case’
“It was an interesting test case for the new method,” Cooper said. “And there was plenty of interest in air quality, which seemed to be improving.”
Cooper was able to improve on methods that use modeling, satellites and ground-monitoring data to infer surface-level amounts of NO2 on any point on the globe. This new method makes better use of the finer-resolution satellite data, enabling researchers to determine levels of NO2 on a scale of about one kilometer.
Understanding levels of NO2 is important for a better understanding of human health. The chemical is one of the primary air pollutants, and it is a precursor to the creation of fine particulate matter. High exposure to NO2 is associated with a variety of health problems, mainly respiratory in nature, as well as a higher risk of mortality, overall.
Because it is primarily formed by burning fuel, researchers suggested the COVID-related lockdowns might lead to decreases in NO2. They did. Significantly.
Taking into account the variations expected by weather trends, and the fact that emissions have been generally decreasing over the past several years due to technological improvements, the researchers were able to infer decreases in surface-level NO2 were almost 30% larger in countries with strict lockdowns versus those without.
Overall, Martin said, “The global decrease during lockdowns was comparable to 15 years of annual reductions from emission controls.”
When they took a closer look, however, researchers found that the decreases were not evenly distributed. “We see very striking spatial variation,” Cooper said. “Find any city and you’ll see a signal.”
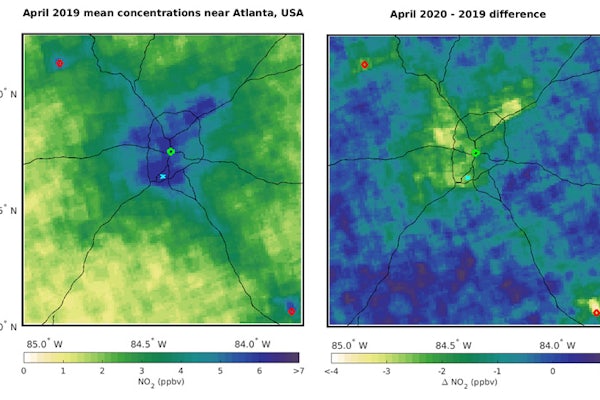
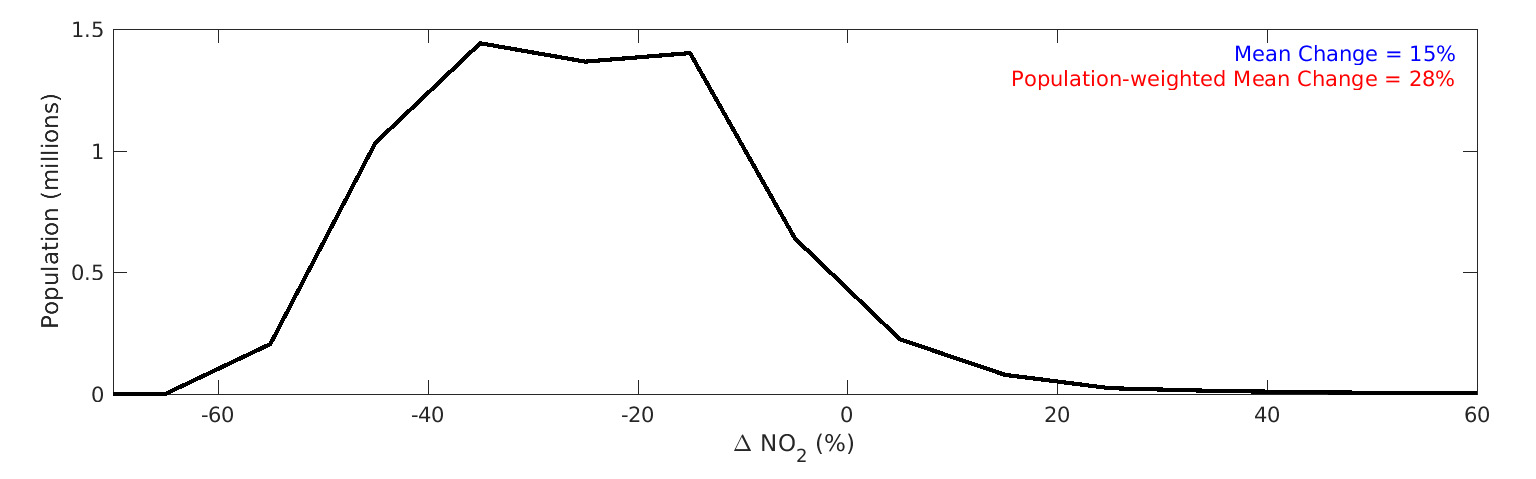
Take Atlanta, for one. Accounting for population, the concentration of NO2 decreased by 28% across the metro area between April 2019 and April 2020. But there is a lot of variation represented within that average rate.
For example, more than 1.2 million people in the region saw a more than 40% decrease in NO2 levels. However, nearly 1 million people experienced decreases of only 10% or less. Changes were generally larger for those living near coal-powered plants or the airport than in the downtown core.
Or Paris. More than 1 million people in the Paris metropolitan area saw a decrease in NO2 of 75% or more, while other metro areas saw a decrease in NO2 of 23% or less.
The benefits to this finer resolution go beyond identifying the unequal burden of pollution between neighbors. It also can help researchers better infer pollution levels in areas where there is no other way to determine levels of NO2. A significant part of the world does not have sufficient — or any — ground monitoring of pollutants.
Of the 215 cities the researchers investigated, 68 had no previous ground-monitoring data. Most of those cities, the researchers noted, were in lower-income countries in Africa and Southeast Asia. The average gross national income per capita for these unmonitored cities was $7,000. That’s in comparison with $25,000 for cities in countries with reliable ground monitoring.
“Although lower-income countries are less likely to have local air quality monitoring,” Cooper said, “large lockdown-driven changes in exposure to NO2 occurred regardless.”
This research was supported by Environment and Climate Change Canada and by the Canadian Urban Environmental Health Research Consortium; by NASA (673 80NSSC21K1343). We thank the OMI instrument team, and the OMI and TROPOMI teams for making NO2 data publicly available.
Click on the topics below for more stories in those areas
Back to NewsFaculty in this story


